
High-density lipoprotein (HDL) metabolism and bone mass
- 1Department of Anatomy-Histology-Embryology, Unit of Bone and Soft Tissue Studies, University of Patras Medical School, Patras, Greece
- 2Department of Pathology, University of Pittsburgh School of Medicine, Pittsburgh, Pennsylvania, USA
- 3Pittsburgh VA Medical Center, Pittsburgh, Pennsylvania, USA
- 4Department of Pharmacology, University of Patras Medical School, Patras, Greece
- Correspondence should be addressed to D J Papachristou; Email: papachristoudj{at}med.upatras.gr
-
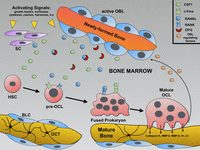 Figure 1
Diagram depicting the growth factors, cytokines and receptors that are involved in the ‘coupling’ between osteoblasts and osteoclasts and the regulation of osteoclast maturation and bone resorption. These phenomena that take place in the bone marrow are described in detail in the text. It should be noted that mature osteoclasts should adhere tightly to bone surfaces (mainly through ανβ3 intern adhesions) to accomplish bone resorption. Moreover, note that the activated osteoblasts are large, cuboidal cells, with hefty nucleus; on the contrary, inactive bone lining cells are spindle shaped, with small elongated nucleus. Under specific stimuli, bone lining cells become metabolically active osteoblasts, regaining their bone-producing capacity. BLC, bone lining cells; CSF1, colony stimulation factor-1; HSC, hematopoietic stem cells; IL, interleukin; MMP, matrix metalloproteases; OBL, osteoblasts; OCL, osteoclasts; OCT, osteocyte; OPG, osteoprotegerin; RANK, receptor activator for nuclear factor κB; RANKL, RANK-ligand; SC, stromal cells.
-
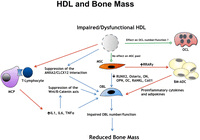 Figure 2
This diagram shows the molecular mechanisms that underline the effect of impaired and/or dysfunctional HDL on bone mass. The red arrows represent the ‘positive’ effects, the blue arrows represent the ‘negative’ effects and the green arrows are indicative of ‘no’ or ‘undefined’ effect. ANXA2, Annexin-2; BM-ADC, bone marrow adipocytes; CLCX12, CXC chemokine ligand 12; Coll, collagen; IL, interleukin; MCP, macrophages; MSC, mesenchymal stem cells; OC, osteocalcin; OCL, osteoclast; OBL, osteoblast; ON, osteonectin; OPN, osteopontin; RANK, receptor activator for nuclear factor κB; RANKL, RANK Ligand; TNFα, tumor necrosis factor alpha.
-
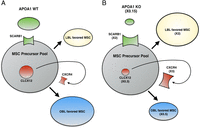 Figure 3
Diagram depicting the molecular changes observed in the ApoA-1-knockout mice (B) in comparison to their wild-type counterparts (A). All the molecular alterations are described in detail in the text. Note that the increased or decreased expression levels are represented by larger or smaller boxes. For example in the ApoA-1-deficient mice, the expression of CXCL12 is significantly decreased (X0.3), whereas the expression levels of its CXCL12 receptor CXCR4 is greatly elevated (X3). APOA1, Apolipoprotein A-1; CLCX12, CXC chemokine ligand 12; CXCR4, CXC Receptor 4; LBL, lipoblast; MSC, mesenchymal stem cells; OBL, osteoblast; WT, wild type.
- © 2017 Society for Endocrinology


