In female rat heart mitochondria, oophorectomy results in loss of oxidative phosphorylation
- Natalia Pavón1,*⇑,
- Alfredo Cabrera-Orefice2,*,
- Juan Carlos Gallardo-Pérez3,
- Cristina Uribe-Alvarez2,
- Nadia A Rivero-Segura4,
- Edgar Ricardo Vazquez-Martínez4,
- Marco Cerbón4,
- Eduardo Martínez-Abundis5,
- Juan Carlos Torres-Narvaez1,
- Raúl Martínez-Memije6,
- Francisco-Javier Roldán-Gómez7 and
- Salvador Uribe-Carvajal2
- 1Departamento de Farmacología, Instituto Nacional de Cardiología Ignacio Chávez, México, Mexico
- 2Departamento de Genética Molecular, Instituto de Fisiología Celular, Universidad Nacional Autónoma de México, México D.F., Mexico
- 3Departamento de Bioquímica, Instituto Nacional de Cardiología Ignacio Chávez, México, Mexico
- 4Unidad de Investigación en Reproducción Humana, Instituto Nacional de Perinatología-Facultad de Química UNAM, México D.F., Mexico
- 5División Académica Multidisciplinaria de Comalcalco, Universidad Juárez Autónoma de Tabasco, México, Mexico
- 6Departamento de Instrumentación Electromecánica, Instituto Nacional de Cardiología Ignacio Chávez, Tlalpan DF, México, Mexico
- 7Departamento de Consulta externa, Instituto Nacional de Cardiología Ignacio Chávez, México, Mexico
- Correspondence should be addressed to N Pavón; Email: pavitonat{at}yahoo.com.mx
-
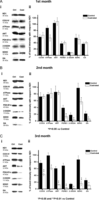 Figure 1
Progressive mitochondrial protein contents modifications during the first three months after oophorectomy. Panel A, one month; panel B, two months; panel C, third month after castration. Left panels (i) western blot analysis of proteins from intact (Ctrl) and castrated (Cast) female rat mitochondria. ND1, NADH ubiquinone oxidoreductase (complex I); COX IV, cytochrome c oxidase subunit 4; ATPase, ATP synthase subunit 5B (beta); ANT, adenine nucleotide translocase; PDH-E1α, pyruvate dehydrogenase subunit E1; 2-OGDH, α-ketoglutarate dehydrogenase; SDHC, succinate dehydrogenase subunit B; GA, glutaminase. Right panels (ii), variations in protein contents compared to the control ND1. Representative blots and data from three independent experiments; *P < 0.05 and **P < 0.01.
-
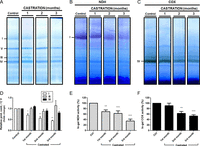 Figure 2
Progressive effects of castration on heart mitochondrial OxPhos complexes I, III, IV and V from female rats. Lanes are from control (Ctrl) and 1-, 2- and 3-month castrated rat heart mitochondrial samples. Isolated mitochondria were solubilized with lauryl-maltoside (LM) 2 mg/mg protein before electrophoretic separation. (A) Different samples were resolved by BN-PAGE in a 4–12% polyacrylamide gradient gel and were subjected to Coomassie staining. (B) In-gel NADH dehydrogenase activity (NDH); 1 mM NADH and 0.5 mg/mL Nitrotetrazolium blue chloride (NTB). (C) In-gel cytochrome c oxidase activity (COX); 0.04% diaminobenzidine and 0.02% cytochrome c. (D, E and F) Densitometry analysis of different protein bands from panels A (complexes I, III, IV and V), B (complex I in-gel activity (NDH)) and C (complex IV in-gel activity (IV)), respectively; *P < 0.05, **P < 0.01, ***P < 0.01. Representative figures from 3 independent gels. Respiratory chain complexes of interest are marked as I and IV. ATP synthase (V) was used as loading control. A full colour version of this figure is available at http://dx.doi.org/10.1530/JOE-16-0161.
-
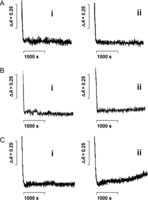 Figure 3
Effect of castration on Ca2+ transport by heart mitochondria isolated from female rats at different castration times. Mitochondrial protein (2 mg) was added to 3 mL of a medium containing 125 mM KCl, 10 mM succinate, 10 mM HEPES, 3 mM phosphate, 100 µM ADP, 100 µM CaCl2, 5 µg rotenone and 50 µM arsenazo III. Arsenazo III absorbance changes were followed at 675–685 nm; room temperature. Panel A, trace (i) shows intact female mitochondria from 1 month; trace (ii) shows castrated female mitochondria from 1 month; panel B trace (i) shows intact female mitochondria from 2 months; trace (ii) shows castrated female mitochondria from 2 months; panel C trace (i) shows intact female mitochondria from 3 months; trace (ii) shows castrated female mitochondria from 3 months. Representative traces from 10 independent experiments.
-
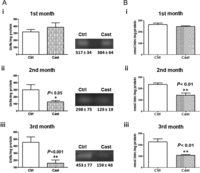 Figure 4
Superoxide dismutase (MnSOD) and aconitase activities in heart mitochondria from control and castrated female rats. Panel A figure (i) shows MnSOD activity in heart mitochondria from control (Ctrl) and castrated (Cast) rats after 1st month; figure (ii) shows MnSOD activity in Ctrl and Cast rats at the 2nd month; figure (iii) shows MnSOD activity in Ctrl and Cast at the 3rd month. Representative figures from 5 independent gels; images are representative of 10 separate experiments. Panel B trace (i) shows aconitase activity in Ctrl and Cast heart mitochondria at the 1st month; trace (ii) shows aconitase activity at the 2nd month and trace (iii) shows aconitase activity at the 3rd month. The results are expressed as the mean ± s.d. from 10 different experiments. Unpaired t-test was used for statistical analysis. *P < 0.05, **P < 0.01.
-
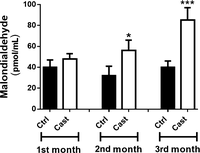 Figure 5
Lipoperoxidation expressed as malondialdehyde generation in heart mitochondria from Ctrl and Cast female rats. The results are expressed as mean ± s.d. for 10 different samples per group analyzed. 2 mg of protein were used and malondialdehyde was separated at −25 kV/4 min at 267 nm. Results were expressed as pmol/mL. *P < 0.05, ***P < 0.001.
-
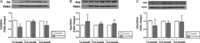 Figure 6
Western blot detection of proteins Fis-1, Drp-1 and OPA-1. Panel A shows content of Fis-1 in each experimental group; Panel B shows the content of Drp-1 and Panel C, OPA-1 content. In all cases, 30 μg of each sample were loaded per lane. VDAC was used as loading control. Bars represent mean ± s.e.m. of 3 independent experiments; *P < 0.05.
-
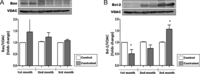 Figure 7
Western blot detection of proteins Bax and Bcl-2. Panel A shows the content of Bax in each experimental group. Panel B shows content of Bcl-2 in each experimental group. VDAC was used as loading control. Bars represent mean ± s.e.m. of 3 independent experiments; *P < 0.05.
- © 2017 Society for Endocrinology