Sexually dimorphic transcription of estrogen receptors in cod gonads throughout a reproductive cycle
- Kazue Nagasawa1*,
- Christopher Presslauer1,
- Lech Kirtiklis1,2,
- Igor Babiak1 and
- Jorge M O Fernandes1⇑
- 1Faculty of Biosciences and Aquaculture, University of Nordland, 8049 Bodø, Norway
2Department of Zoology, Faculty of Biology and Biotechnology, University of Warmia and Mazury in Olsztyn, 10-718 Olsztyn, Poland
- Correspondence should be addressed to J M O Fernandes; Email: jfe{at}uin.no
-
Figure 1
Histology of representative testes and ovaries at different maturation status using hematoxylin–eosin staining in 2-year-old Atlantic cod throughout an annual reproductive cycle. (A) Spermatogonia and cysts of primary spermatocytes. (B) Cysts of spermatocytes. (C and D) Cysts of spermatocytes and lobules containing spermatozoa. (E) Gonadal myoid cells with remaining spermatozoa. (F) Perinuclear stage oocytes with a large circular nucleus and peripheral nucleoli. (G) Oocyte with cortical alveoli, chorion, and nucleus with detached nucleoli. (H) Vitellogenic oocytes with yolk granules filling most of the cytoplasm and a large central nucleus. (I) Vitellogenic oocyte with enlarged yolk granules, eccentric nucleus, and chorion. (J) Hydrated egg in follicle sac with post-ovulatory follicle. Arrowheads, spermatogonia; arrows, primary spermatocytes; ca, cortical alveoli; ch, chorion; ct, connective tissue; f, follicle layer; gmc, gonadal myoid cells; he, hydrated egg; n, nucleus; nu, nucleolus; SC, spermatocytes; SZ, spermatozoa; and yg, yolk granule. The scale bars represent 100 μm. A full colour version of this figure is available at http://dx.doi.org/10.1530/JME-13-0187.
-
Figure 2
Phylogenetic inference of ER subtypes found in vertebrates. The numbers at the nodes indicate posterior probability obtained from Bayesian analysis. GenBank accession numbers of all ERs are given in Supplementary Table 1.
-
Figure 3
Tissue distribution of three esr paralogs in 2-year-old Atlantic cod adult tissues was analyzed by semi-quantitative RT-PCR. The three esr genes were differentially expressed among the tissues tested and showed a sexually dimorphic expression pattern (male, GSI=4.7% and female, GSI=1.5%). The arp gene was used as an endogenous reference gene, as it showed stable expression among all tissues in Atlantic cod.
-
Figure 4
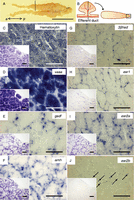
Localization of transcripts of three esrs, vasa, gsdf, 3βhsd, and amh in Atlantic cod testes. (A) Excised testis from 2-year-old Atlantic cod (GSI=0.4%). The dashed line indicates the region sampled for ISH analysis. a, anterior and p, posterior. (B) Schematic representations of a testicular lobe connected to efferent duct (left panel in (B)) and its cross-sectional image (right panel in (B)). The dashed line indicates the section location. The area enclosed by the black box in (B) indicates the position of low-magnification fields (insets in (C, D, E, F, G, H, I and J)). (C, D, E, F, G, H, I and J) Hematoxylin staining (C) and ISH staining with sense or anti-sense probes for vasa (D), gsdf (E), amh (F), 3βhsd (G), esr1 (H), esr2a (I), and esr2b (J). (C, D, E, F, G, H, I and J) High-magnification fields taken from the areas adjacent to insets. White arrowheads indicate spermatogonia. SC, spermatocytes. Arrows indicate the position of weak signals that were detected in interstitial fibroblasts. The bars represent 5 cm (A), 100 μm (C, D, E, F, G, H, I and J), and 200 μm (insets in (C, D, E, F, G, H, I and J)). A full colour version of this figure is available at http://dx.doi.org/10.1530/JME-13-0187
-
Figure 5
Localization of transcripts of three esrs, vasa, and gsdf in Atlantic cod ovary. (A) Excised ovary from 2-year-old Atlantic cod (GSI=1.3%). The region sampled for ISH analysis is indicated by the dashed line. a, anterior and p, posterior. (B) Schematic representation of cross section of ovary. The area enclosed by the black box in (B) indicates the position of low-magnification fields (insets in (C, D, E, F, G and H)). (C, D, E, F, G and H) Hematoxylin staining (C) and ISH staining with anti-sense probes for vasa (D), gsdf (E), esr1 (F), esr2a (G), and esr2b (H). (C, D, E, F, G and H) High-magnification fields taken from the areas adjacent to insets. The bars represent 5 cm (A), 100 μm (C, D, E, F, G and H), and 200 μm (insets in (C, D, E, F, G and H)). A full colour version of this figure is available at http://dx.doi.org/10.1530/JME-13-0187
-
Figure 6
Quantification of three esrs (A, B and C), ar (D), and cyp19a1a (E) in gonads of Atlantic cod throughout the reproductive cycle. Black and white bars show the relative mRNA expression in testes and ovaries respectively. Transcript levels were quantified by real-time PCR. Error bars show s.e.m. at each sampling time point. Different superscript letters indicate significant differences within the same sex throughout the reproductive cycle (capital letters, testes and lower-case letters, ovaries; n=25). Asterisks (*) indicate significant differences between testes and ovaries at a particular sampling point at P<0.05 (n=5).
- © 2014 Society for Endocrinology


