Brachyury, a vaccine target, is overexpressed in triple-negative breast cancer
- Duane H Hamilton1,
- Mario Roselli2,
- Patrizia Ferroni3,
- Leopoldo Costarelli4,
- Francesco Cavaliere5,
- Mariateresa Taffuri4,
- Claudia Palena1⇑ and
- Fiorella Guadagni3,6
- 1Laboratory of Tumor Immunology and Biology, Center for Cancer Research, National Cancer Institute, NIH, Bethesda, Maryland, USA
- 2Department of Systems Medicine, Medical Oncology, Tor Vergata Clinical Center, Tor Vergata University of Rome, Rome, Italy
- 3San Raffaele Roma Open University, Rome, Italy
- 4Department of Pathology, San Giovanni Hospital-Addolorata, Rome, Italy
- 5Department of Surgery, San Giovanni Hospital-Addolorata, Rome, Italy
- 6Interinstitutional Multidisciplinary Biobank (BioBIM), IRCCS San Raffaele Pisana, Rome, Italy
- Correspondence should be addressed to C Palena; Email: palenac{at}mail.nih.gov
-
Figure 1
Brachyury mRNA upregulation in TNBC and basal breast cancers. (A) Analysis of expression of indicated transcripts in the breast cancer TCGA dataset, according to the level of brachyury (T) mRNA expression. Percent of tumors in the TCGA database that are positive for brachyury (T) mRNA expression in samples classified based on their hormone receptor expression (B) or according to the molecular classification (C). Analysis of expression of indicated transcripts in breast cancer samples of the TCGA database, classified as triple positive vs TNBC, in accordance with their expression of hormone receptors (D). Statistics were calculated using an unpaired t-test (*P < 0.05; ***P < 0.001; ****P < 0.0001; ns, not significant).
-
Figure 2
Immunohistochemical analysis of brachyury expression in primary and metastatic TNBC. Representative photomicrographs of brachyury staining on primary TNBC cases are reported on panels A and B. (A) Stage IIIB T2N3aM0 primary IDC (patient 71) showing positive nuclear and cytoplasmic staining in 80 and 40% of cancer cells, respectively. (B) Stage I T1cN0M0 primary IDC (patient 28) showing negative (<5%) nuclear and cytoplasmic staining in cancer cells. (C) Pleural metastatic lesion (patient 84) showing positive nuclear and cytoplasmic staining in 80 and 20% of cancer cells, respectively. (D) Detail of brachyury staining at higher magnification (400×). (E) and (F) represent bone (patient 86) and lymph node (patient 78) metastasis with positive nuclear (60 and 100%, respectively) and cytoplasmic (70 and 100%, respectively) brachyury expression in cancer cells. Magnification: 200× (except panel D: 400×).
-
Figure 3
Immunohistochemical analysis of brachyury expression in primary TNBC and normal breast tissues adjacent or distant to the tumor. (A) Stage IIB T2N1aM0 primary tumor (patient 54) showing positive nuclear and cytoplasmic staining in 30 and 20% of cancer cells, respectively; (D) Stage IIA T2N0M0 primary tumor (patient 37) showing nuclear and cytoplasmic staining in 70 and 80% of cancer cells, respectively. Panels (B) and (E) correspond to brachyury staining in breast tissues adjacent to the tumor. Panels (C) and (F) correspond to brachyury staining in breast tissues distant from the tumor. (G) Stage IIA T2N0M0 primary tumor (patient 30) showing both nuclear and cytoplasmic staining in 80% of cancer cells. (H) Brachyury staining in histologically normal breast tissue surrounding the tumor. Panel magnification: 200×.
-
Figure 4
Prevalence of nuclear brachyury expression in metastatic and high-grade TNBC tumors. Brachyury reactivity index observed in the nucleus or the cytoplasm of primary vs metastatic (A) or TNBC samples according to stage (B, C and D). Samples were analyzed by IHC with an anti-brachyury monoclonal antibody. P values were calculated using an unpaired t-test, with values for panel B representing a comparison between stage I and stages III–IV. (ns, not significant).
-
Figure 5
Brachyury expression and prognosis. Kaplan–Meier estimates of recurrence-free survival in 58 cases of TNBC classified based on the brachyury expression level. The two groups (low vs high brachyury) were defined based on the overall brachyury reactivity index set at a cutoff of 240, corresponding to the 75th percentile of expression in the overall population (n = 87).
-
Figure 6
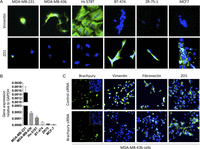
Brachyury associates with mesenchymal features in human TNBC cell lines. (A) Immunofluorescent detection of vimentin and ZO1 (green signal) in a panel of TNBC and non-TNBC cell lines. (B) Relative brachyury mRNA expression levels in the various cell lines. Error bars indicate the standard error of the mean of triplicate measurements. (C) Silencing brachyury expression in MDA-MB-436 cells is associated with a reduction in the expression of mesenchymal markers vimentin and fibronectin and increased expression of the epithelial marker ZO1 (green signal). Blue signal corresponds to DAPI staining of nuclei.
- © 2016 Society for Endocrinology


