
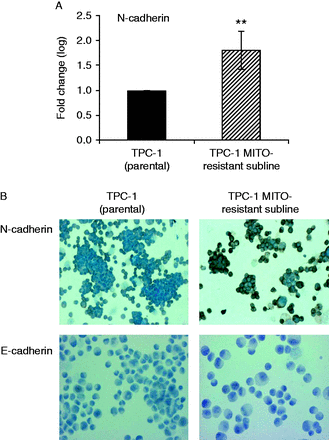
Figure 3
Relative expression of mRNA and protein for N- and E-cadherin in TPC-1 parental cells and the TPC-1 MITO-resistant subline. (A) qRT-PCR analysis shows a significant increase in expression of N-cadherin in the TPC-1 MITO-resistant subline (twofold change, **P<0.01). Bars represent mean±s.d. from three separate experiments. TPC-1 parental cells were used as a control. (B) Representative image of cells stained for N-cadherin (20×magnification) and E-cadherin (20× magnification) by immunocytochemical staining both before and after drug selection.


